This experiment is great for young kids! It is visually appealing and holds their interest as they are busy testing whether different objects sink or swim in the different liquids!
.JPG)
1 .Kids will identify objects that sink and float in different liquids
2. Kids will understand the concept of density through verbal expression
3. Kids will record results on a graph
4 .Kids will make and label a density column diagram
Materials:
- Corn Syrup
- Vegetable Oil
- Food Coloring
- Three glasses
- Five Raisins, penny's, chic peas, sm. balls of paper and paperclips
When we started this experiment I had three clear glasses on the counter with the same amount of three different liquids poured into them. I used about 3/4 cup of corn syrup in the first glass, water in the second and vegetable oil in the third. The corn syrup that I had was the same color as the vegetable oil, so I wanted to drop some food coloring in to distinguish between the three liquids (I would suggest buying a dark colored corn syrup rather than light).
We made a fun discovery when the food coloring dissolved in the water, bubbled up and sank in the vegetable oil and spread out and rested on the top of the corn syrup. Already we had made a discovery! The kids could see that something was different about these three liquids. I love unexpected discovery!!
Next, I distributed the five different objects that we would be testing in the liquids in front of each cup. We were going to drop a penny, a paper clip, a chic, pea, a ball of paper, and a raisin in each cup to see whether it would sink or swim.


Predictions and Observations
- Before we dropped an object into the liquid we made a prediction about whether it would sink or swim
- The kids took turns dropping each object into the liquids
- We recorded our results on our observation graph, circling sink or swim as we dropped the items in the liquids


**Teaching Tip: Keep encouraging them to make predictions each time they drop an item into the liquid. Also, ask them why they think the item is sinking or swimming. What could be the reason? In this experiment you are dropping items into the liquids many times over and you will notice that the kids predictions will get better as they begin to recognize a pattern occurring in each liquid.
Explanation/Conclusion:
After we were finished filling out our graph I began to explain the reason we were seeing different results in each liquid. We talked about how even though each cup had the same amount of liquid, the liquids themselves had some differences. I explained to them that each liquid had a different density or weight. The heavier or denser the liquid is, the easier it was for an object to float in it. We were then able to conclude that the corn syrup was the heaviest liquid, and the water the lightest (we were going to have to adjust our findings as we move forward).
Teaching Tip: Instead of calling it a teaching/mom mistake...I called it adjusting our results through observation!
Density Tower/Part 2:

- Corn Syrup
- Vegetable Oil
- Water
- Tall glass bottle
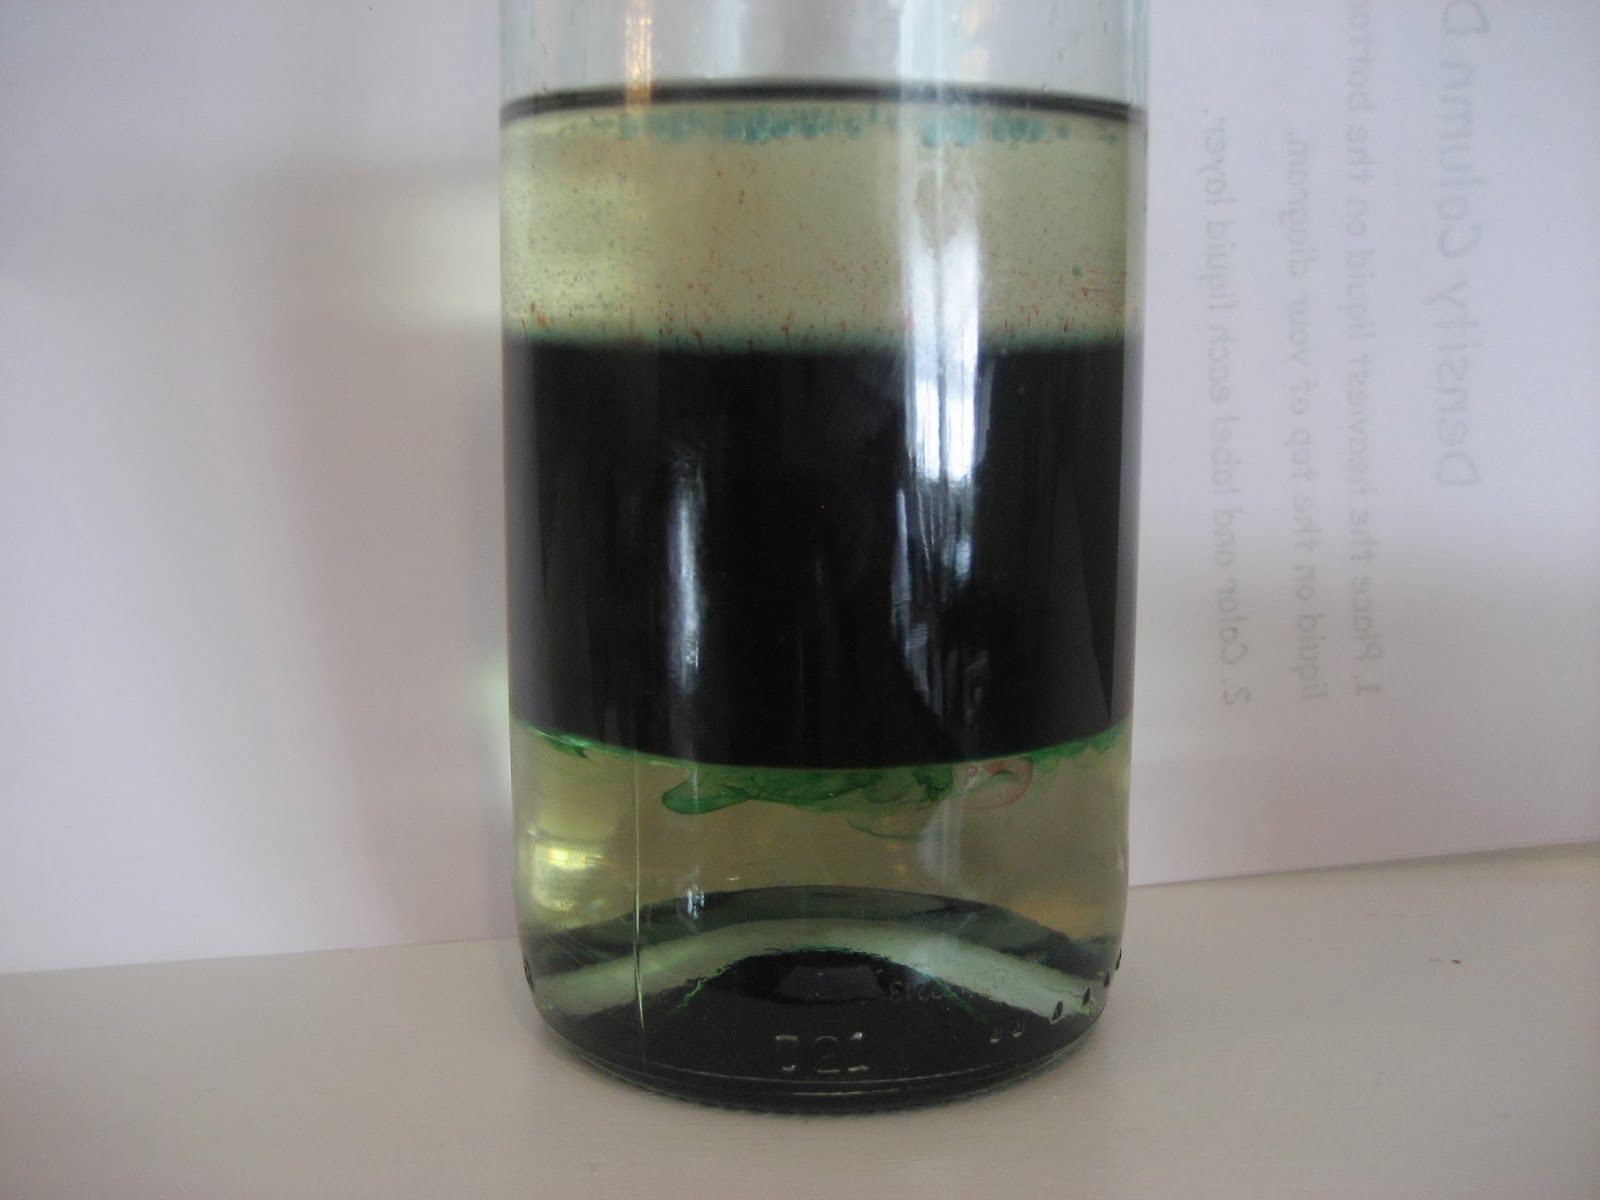
Using the same liquids you are now going to create a quick visual display of your findings! Using a tall glass, bottle or jar (I used an empty wine bottle) you are going to slowly pour the same three liquids together and watch them separate into three separate layers. The liquid with the greatest density or weight will fall to the bottom of the jar followed by the lighter or less dense liquids on top.

**Teaching Tip: We thought that the lightest liquid was the water after conducting the first part of the experiment. After pouring the three liquids into the bottle we found that the vegetable oil was the one that settled on the top of the bottle. We had to make some adjustments on our labeled diagram (you may notice this in our pictures). This was actually a good opportunity to show the kids that often in Science we need to make changes and revisit parts of our experiments multiple times. In fact, a good scientist always tests their results more than once!
The last thing that we did was color and label our Density Column Diagram. I drew the picture of the bottle and separated it into three sections. We reviewed which liquid was the most dense and the least and glued on our labels. Overall, it was another successful learning experience! The column will sit on our counter for a couple of days so we can review what we learned and show dad!


Needed Worksheets:
- Sink or Swim Observation Graph: https://docs.google.com/file/d/0B-4_yroOwt-aWUxNX3o0NXVxbHM/edit
- Density Column Diagram and Labels: https://docs.google.com/file/d/0B-4_yroOwt-aeE10dDhGVGdtZ1U/edit
**Teaching Tip: For older kids you can take it a step further. First, weigh the glass that you are using to hold the liquids. Then, have them carefully measure and record the amount of liquid that you are using to make sure that each glass holds exactly the same amount of liquid. Take each liquid and weigh it on your scale, subtracting the weight of the glass. Lastly, compare the weight/density of each liquid to confirm which liquid is the heaviest and holds the greatest density.
.JPG&description=Living%20Our%20Homeschool%20Life%3A%20Sink%20or%20Swim%20Density%20Column)
No comments :
Post a Comment